Taste Test: Likes vs. Views
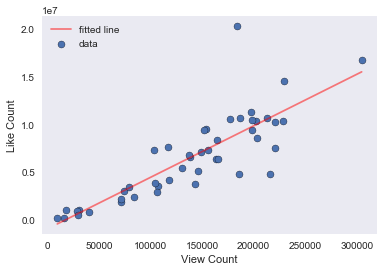
This graph shows that as view count increases, the number of like count increases, which demonstrates a positive relationship (r = 0.83).
The coefficient of determination, r2, is 0.69, indicating that 69% of the variation in comment count can be explained by view count. Additionally, knowing the view count should allow us make an accurate estimate of like count.
To view the fit of the regression model to the data, the best-fitted line, "fitted line", has been plotted in red.
It appears that there is a significant relationship between view and like count, as the p-value is <0.0001. The p-value shows the probability that the slope is zero, which indicates that there is no correlation between the two variables. In this case, the low p-value indicates that the probability that the two variables are not related are very unlikely.
Taken together, these results demonstrate that there is a significant correlation between number of likes and views for the BuzzFeed show, Taste Test.